

Skip to content
Anexet
Product
Solutions
Features
Company
Services

Employee Productivity Monitoring

Each application and website is classified as productive, neutral or unproductive across 590 categories, with active and idle time recorded per session.

Schedule a Demo
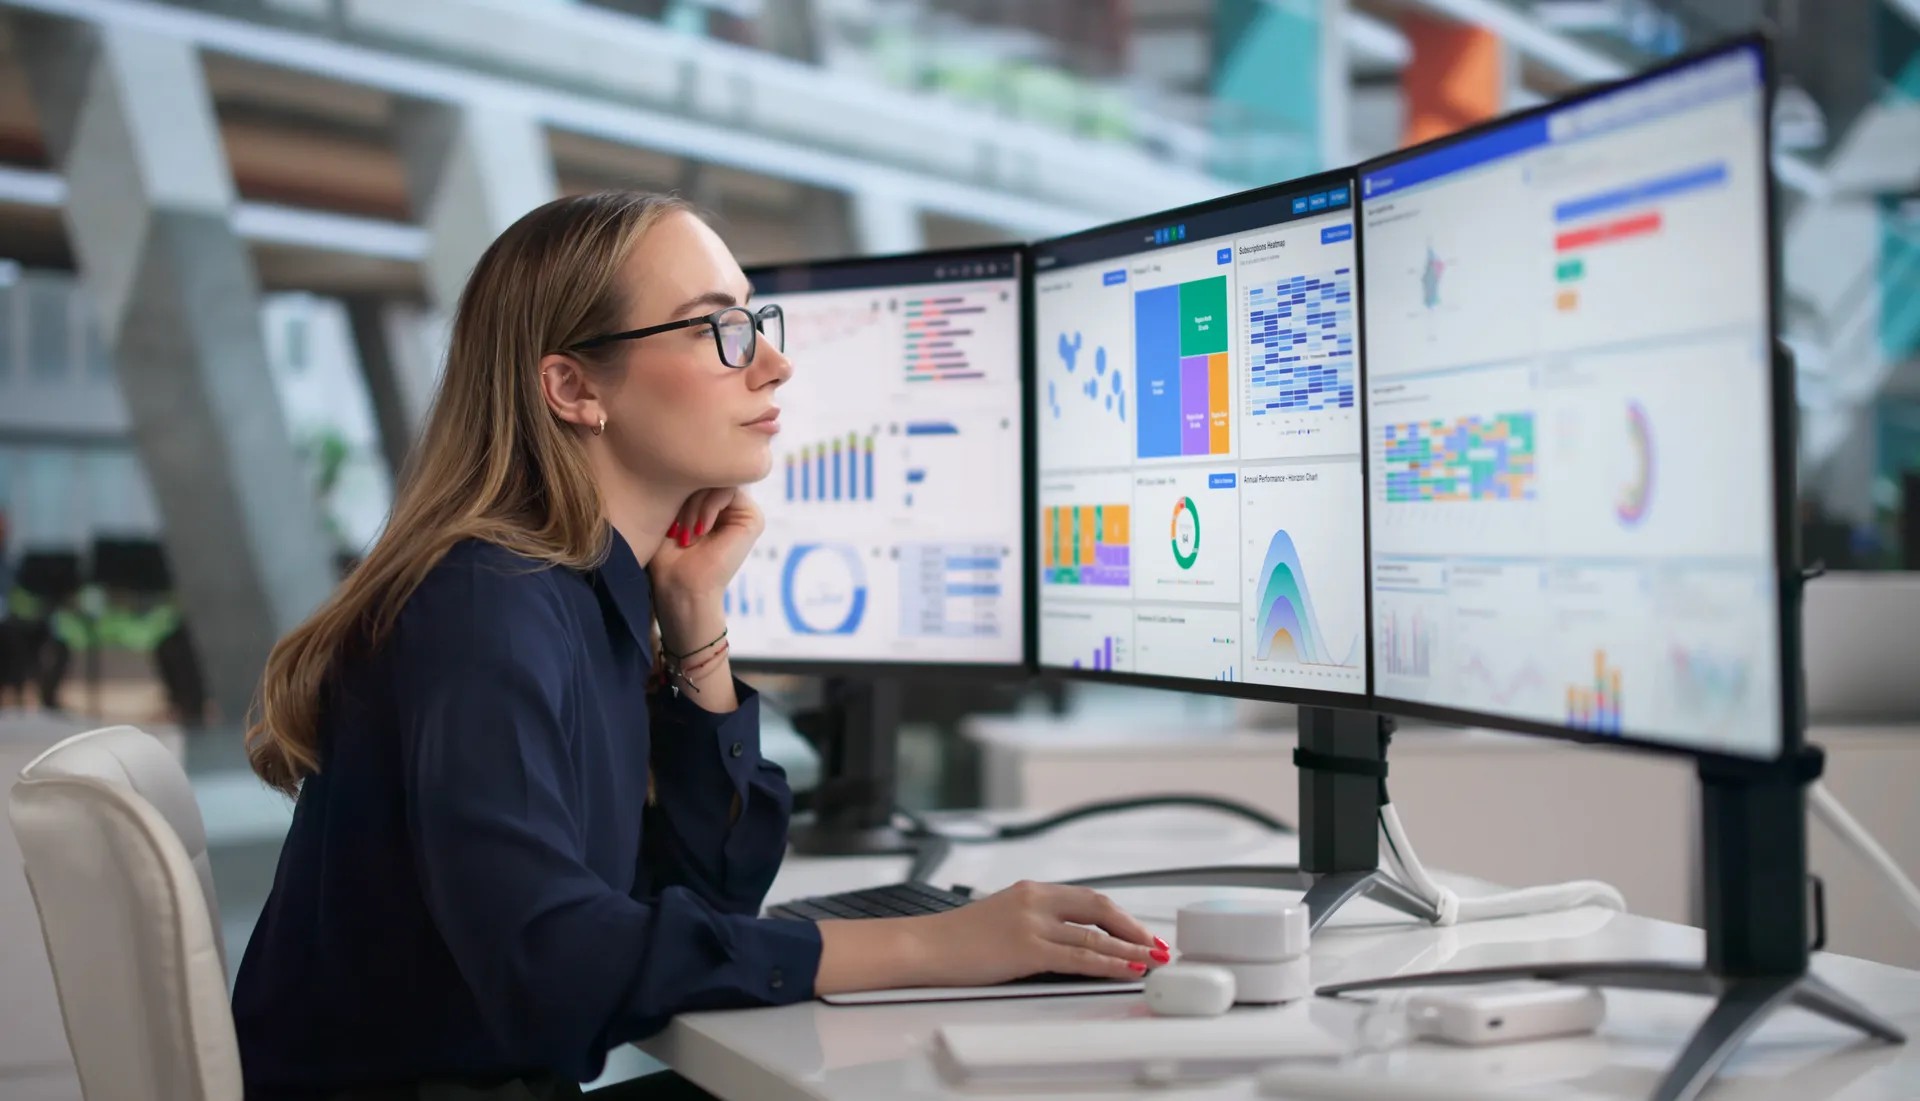
Anexet Client Console showing employee productivity timeline and activity statistics

The Visibility Gap Most Organizations Never Close

Most organizations have no systematic, objective view of how work time is actually spent — leaving security teams and managers working on anecdote rather than evidence.

Managers rely on self-reports; IT security teams can't distinguish genuine work from distraction or misuse. When a data incident occurs — an employee who was idle for two hours before copying files, or one who spent the afternoon on job-search sites — the absence of activity records leaves investigators working blind.

The same visibility gap affects remote teams. Without an objective, always-on record, 'working from home' becomes an untestable assertion, and HR decisions about performance rest on anecdote rather than data.

Productivity monitoring in Anexet serves two distinct audiences: IT-security teams need it as context for incident investigation, and HR and line managers need it for objective performance reviews and workload balancing. Both audiences access the same data; access controls determine who sees what.

Why it matters

  • Objective, timestamped records

    Every application and website interaction is logged with a timestamp and tied to a user identity — facts for investigations, not impressions.

  • 590 predefined categories

    Each app and site is classified Productive, Neutral, or Unproductive out of the box. Administrators can reclassify any category to match their organization's policy.

  • Equal coverage for remote staff

    Because the endpoint agent runs locally, productivity data quality is identical for office and home workers — no VPN required.

What Anexet Measures

Every capability below ships as part of the Standard, Advanced, or Premium plan — the badge on each card shows where it starts.

Time classification & analysis

  • Productivity classification per app and website

    Standard

    Approximately 590 application and website types are categorized as Productive, Neutral, or Unproductive. Administrators configure the classification in the Administrator Console and can reclassify any application or site to match company policy.

  • Active vs. idle time

    Standard

    The system distinguishes genuine active use (keyboard input, mouse movement, application interaction) from idle time (machine on, session open, no user interaction). Both are logged with timestamps and visible per employee in the activity timeline.

  • Unproductive-time analysis

    Standard

    Time spent in Unproductive-labelled applications and websites is aggregated and presented separately, making it straightforward to review which employees, departments, or time windows show high unproductive use.

  • Daily activity and statistics

    Standard

    Summary metrics covering total active time, productive time, unproductive time, and idle time per day, per user, and per group — available for historical retrospective analysis, not just real-time review.

Application & website tracking

  • Desktop activity timeline

    Standard

    A chronological view of every application and process that was active during the workday, with durations. Gives both security investigators and managers a minute-by-minute picture of what an employee was doing.

  • Website visit monitoring

    Standard

    Time spent on each website is recorded alongside its productivity classification. The console surfaces top sites per employee and top sites across the team, making it easy to identify persistent patterns.

  • Application usage monitoring

    Standard

    Which desktop applications were open and for how long, tied to the user identity. The console ranks each employee's most frequently used applications automatically, feeding both productivity reports and incident context — for example, 'employee had a file-sharing app open for three hours before the transfer event'.

Remote & advanced monitoring

  • Remote-employee productivity (WFH)

    Standard

    Productivity metrics and working-hours maps apply equally to remote workers. Because the endpoint agent runs locally, there is no difference in data quality between office and home environments.

    Learn more
  • Real-time activity dashboard

    Advanced

    A configurable User Profile dashboard for each employee combines incidents and recent events, productivity metrics, summary analytics, active processes, and connected devices, all updating in real time. Productivity graphs and a working-hours visualization sit alongside a ranked list of each employee's most-used applications and websites, and audio or video monitoring can be launched directly from the same screen.

  • Risk Analysis (behavioral baseline)

    Premium

    Anomalous behavior tracking that detects when an unusual change in work patterns correlates with other risk indicators, including deviations from a user's productivity baseline.

    Learn more

Keylogging and webcam snapshots are covered in detail on their dedicated pages. Pricing is Price on Request; minimum 5 licences.

How Productivity Data Is Collected

The Anexet endpoint agent runs silently in the background on the employee's Windows, Linux, or macOS machine. It records which application has focus, for how long, and whether the user is actively interacting with it. All data is sent to your on-premise server — nothing is transmitted to a cloud service.

Because the entire deployment lives inside your infrastructure, the vendor — Scinero Software Limited — has no access to your servers, your employees' activity data, or any records the system produces. All data stays within your infrastructure under your control.

Recorded video clips carry the same productivity context: each recording overlays which applications were active and the associated productivity metrics directly inside the footage, so a reviewer never has to cross-reference a separate activity log to see what an employee was doing at a given moment.

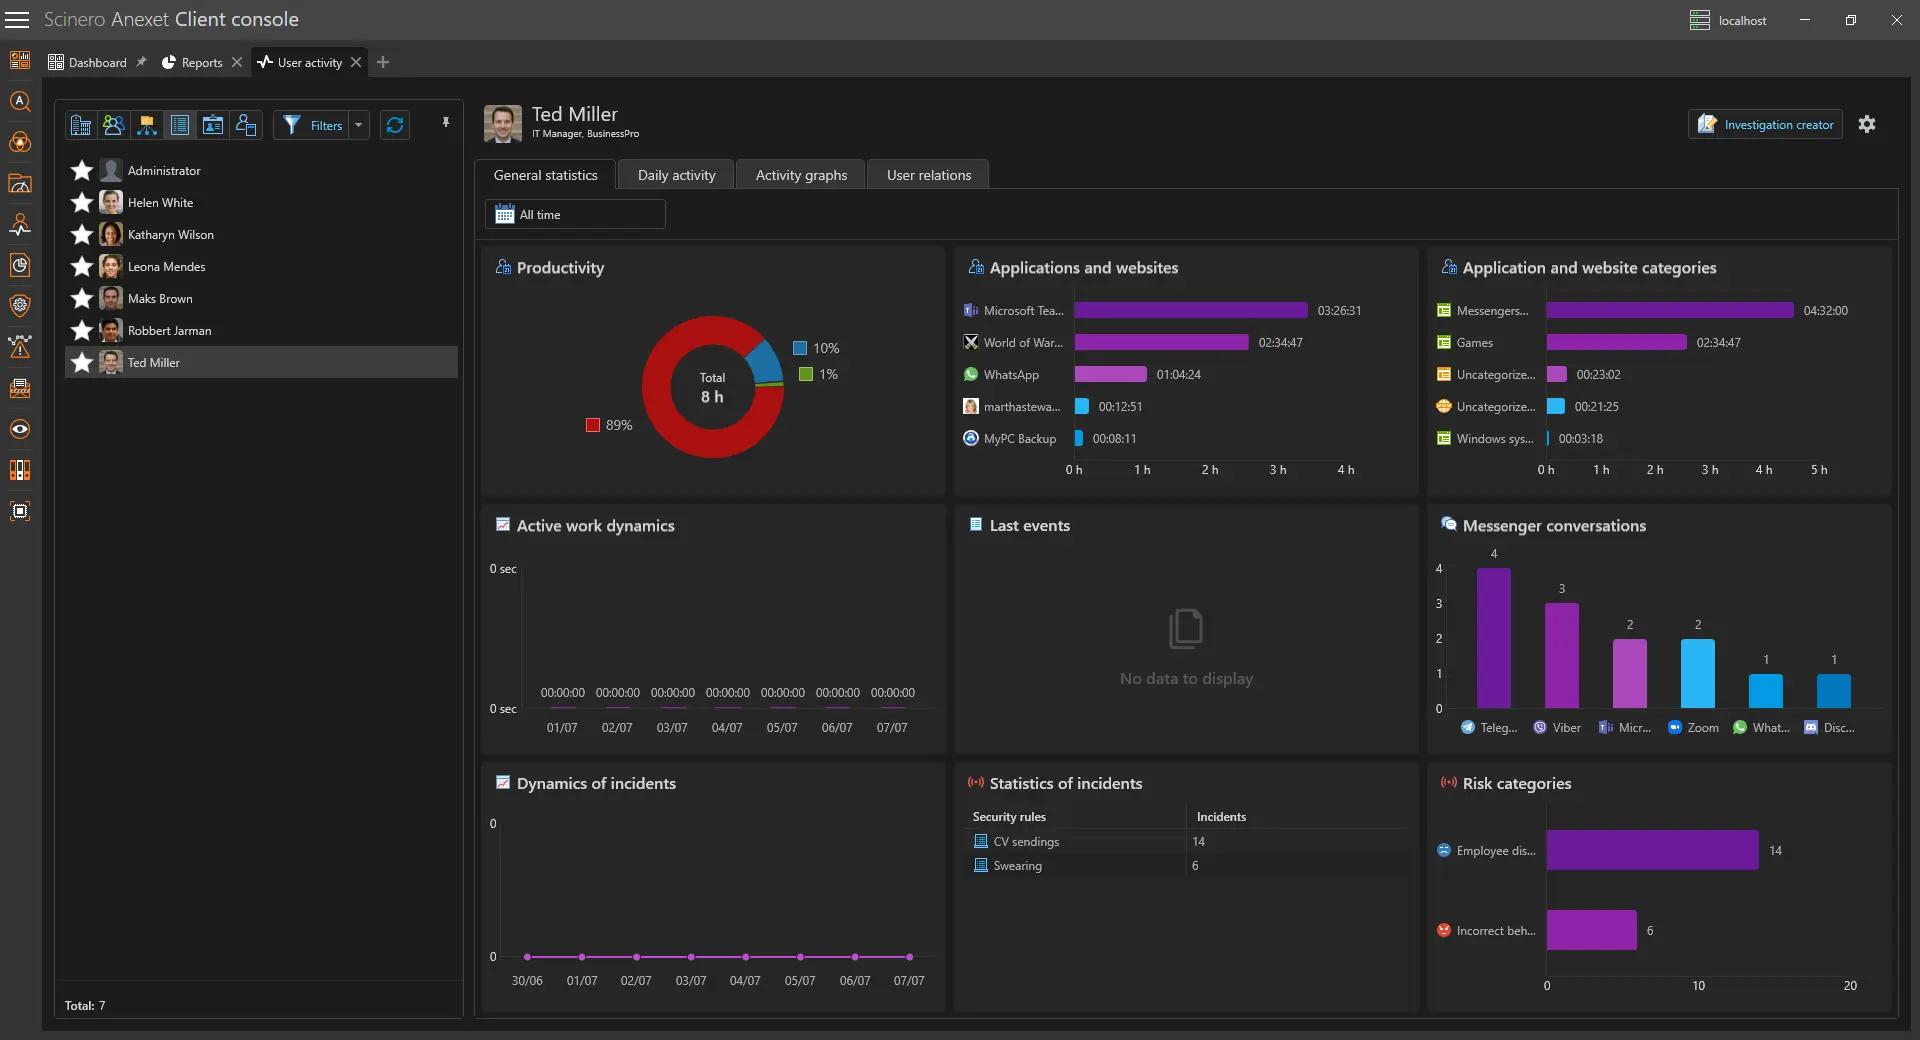
Anexet Client Console showing employee productivity statistics by day
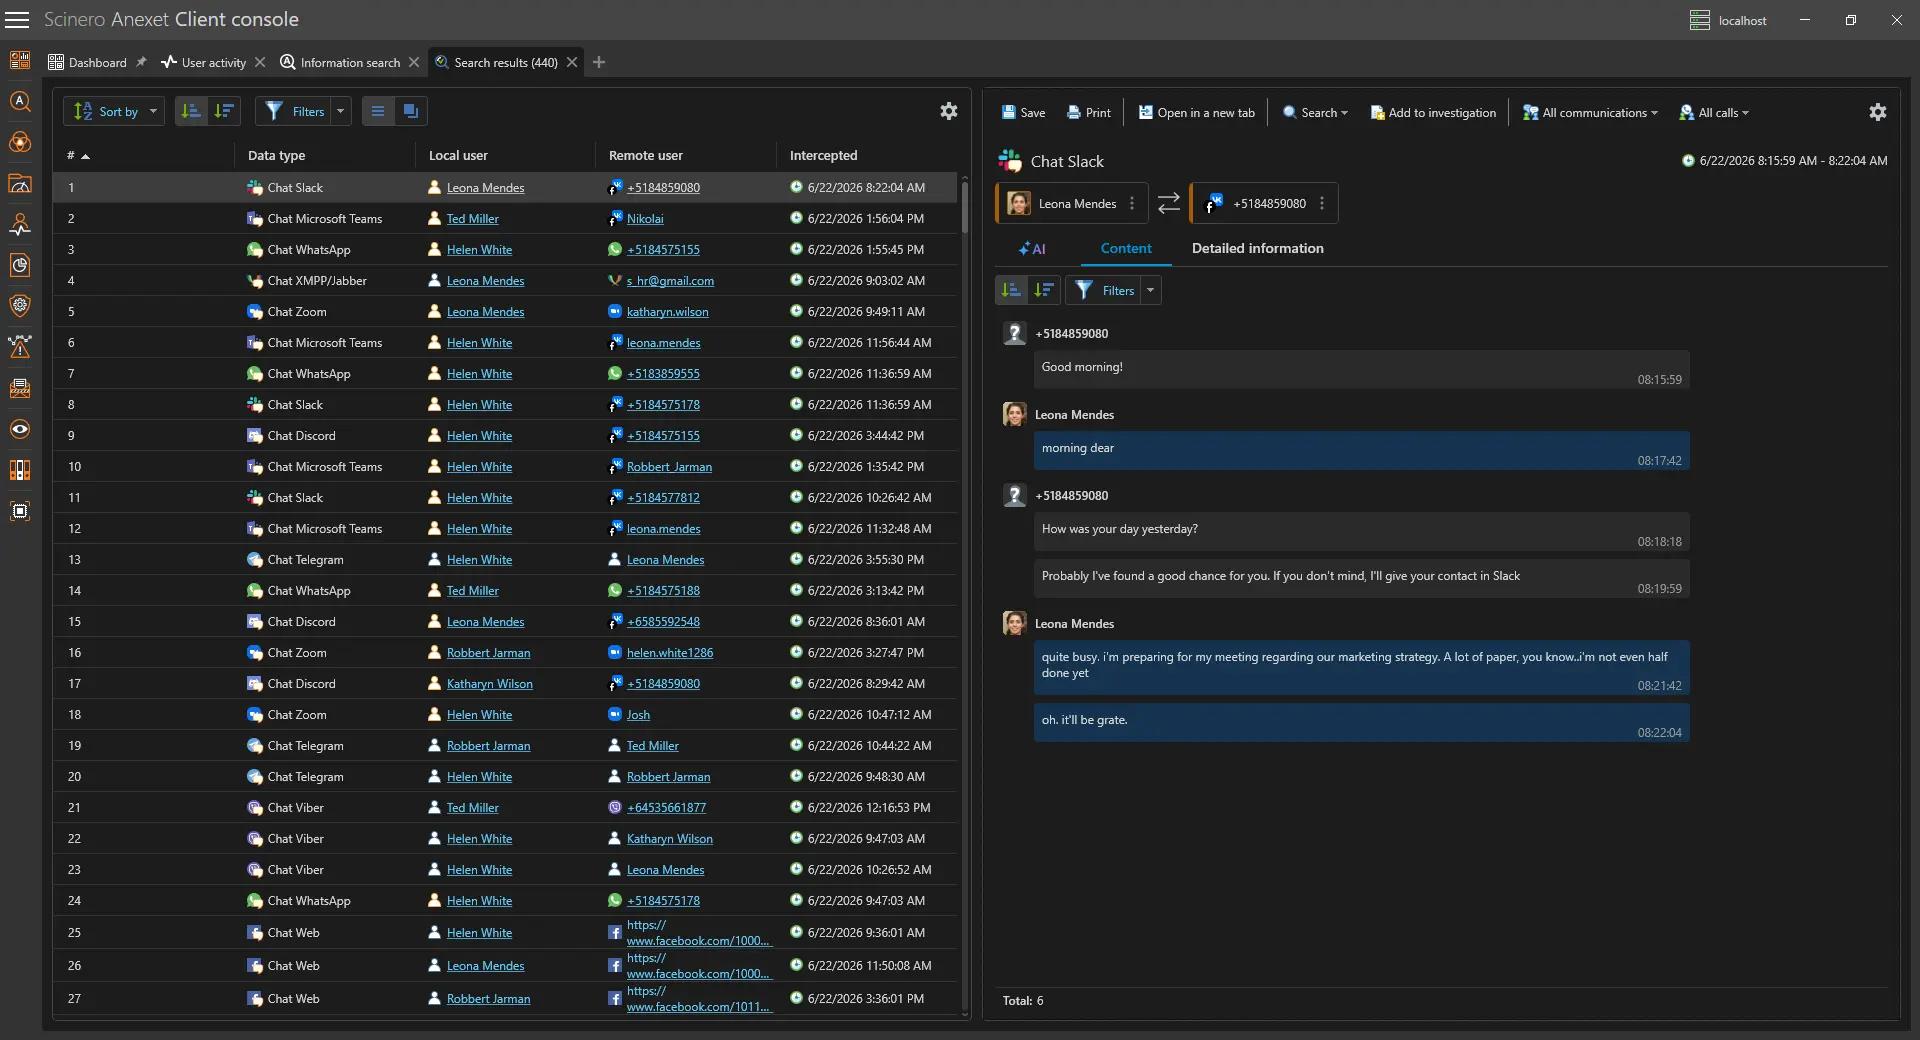
Desktop activity timeline in the Anexet Client Console

How Productivity Monitoring Works

Four steps from an employee's workstation to actionable productivity data in the console.

The endpoint agent runs silently on the employee's Windows, Linux, or macOS machine, recording which application has focus and whether the user is actively interacting.

1

The on-premise server receives the activity stream and classifies each application and website as Productive, Neutral, or Unproductive using the configured category table.

2

Administrators configure productivity categories, set alert thresholds, and search activity records by user, date, application, site, or productivity label.

3

Security and HR teams review daily summaries, timelines, and comparative reports in the Client Console — with no vendor access involved at any stage.

4

The endpoint agent runs silently on the employee's Windows, Linux, or macOS machine, recording which application has focus and whether the user is actively interacting.

1

The on-premise server receives the activity stream and classifies each application and website as Productive, Neutral, or Unproductive using the configured category table.

2

Administrators configure productivity categories, set alert thresholds, and search activity records by user, date, application, site, or productivity label.

3

Security and HR teams review daily summaries, timelines, and comparative reports in the Client Console — with no vendor access involved at any stage.

4

Arrow

Productivity Monitoring by Plan

StandardCore employee activity monitoring.
Network traffic interception
USB control
Printer monitoring
Messenger interception
Browser interception
and 4 more
Most popular
AdvancedAdds DLP and deeper visibility.
Standard plan included
DLP features
Network share monitoring
Keylogger
Webcam pictures
and 4 more
All-in-one
PremiumAll-in-one solution.
Standard + Advanced plans included
Advanced search (digital fingerprints, hash search)
File system monitoring
User relationship analysis
Risk analysis
and 6 more

Frequently Asked Questions

Common questions about how Anexet measures and reports employee productivity.

What does employee productivity monitoring software actually measure?

It measures how work time is distributed across applications and websites, categorised as Productive, Neutral, or Unproductive. Anexet records active time (genuine interaction), idle time (session open, no interaction), and time in each category — per user, per day, per group — with full historical replay available in the Client Console.

Productivity accounting, active/idle time tracking, and unproductive-time analysis are all included in the Standard plan — the entry plan. The real-time activity dashboard (multi-metric overview) is included from Advanced, and behavioral Risk Analysis is included from Premium. Our team confirms the exact coverage for your plan during the demo.

Anexet ships with approximately 590 predefined application and website categories, each assigned a default Productive, Neutral, or Unproductive label. Administrators can reclassify any category or individual application to match the organization's policies. A project-management tool might be Productive in one organization and Neutral in another — the system adapts to the administrator's decisions, not the other way around.

Yes. Anexet is deployed entirely on-premise inside the organization's network. The vendor — Scinero Software Limited — has no access to your servers, your employees' activity data, or any records the system produces. All data stays within your infrastructure under your control.

No. Productivity monitoring records which applications and websites have focus and for how long. It does not capture keystrokes (that is the Keylogger feature) or continuous screen recordings (that is the Scheduled Recording feature). Productivity monitoring is an objective time-accounting layer; keylogging and screen recording are separate capabilities each controlled by distinct policies.

Yes. Because the endpoint agent runs locally on the employee's machine, productivity data quality is identical for office and home workers. No VPN is required for data collection, and the same reports, timelines, and alert thresholds apply regardless of where the employee is working.

Yes. The User Profile dashboard brings together one employee's incidents and recent events, productivity metrics, summary analytics, active processes, and connected devices in a single real-time screen. Productivity graphs and a working-hours visualization sit alongside a ranked list of that employee's most-used applications and websites, and managers can launch audio or video monitoring or generate a detailed report directly from the same view.

Productivity monitoring is appropriate when used within a documented, proportionate workplace policy communicated to employees. Because the system is on-premise and under the organization's control, the data stays internal and is not shared with the vendor. Organizations typically use productivity data for objective performance reviews, workload management, and identifying employees who may need support. Combining it with a transparent acceptable-use policy and clear communication to staff is the recommended approach for compliant, proportionate deployment.

Three professionals collaborating and looking at a tablet in a meeting

See Productivity Data in Your Environment

Tell us about your organization's size and how you want to use productivity data — we'll match it to the right plan and arrange a demo or a free trial of Anexet Ultimate.

I accept that my personal data can be processed in accordance with the Privacy Policy